The burden of child and maternal malnutrition and trends in its indicators in the states of India: the Global Burden of Disease Study 1990–2017

Abstract
Malnutrition is a major contributor to disease burden in India. To inform subnational action, we aimed to assess the disease burden due to malnutrition and the trends in its indicators in every state of India in relation to Indian and global nutrition targets.
We analysed the disease burden attributable to child and maternal malnutrition, and the trends in the malnutrition indicators from 1990 to 2017 in every state of India using all accessible data from multiple sources, as part of Global Burden of Diseases, Injuries, and Risk Factors Study (GBD) 2017. The states were categorised into three groups using their Socio-demographic Index (SDI) calculated by GBD on the basis of per capita income, mean education, and fertility rate in women younger than 25 years. We projected the prevalence of malnutrition indicators for the states of India up to 2030 on the basis of the 1990–2017 trends for comparison with India National Nutrition Mission (NNM) 2022 and WHO and UNICEF 2030 targets.
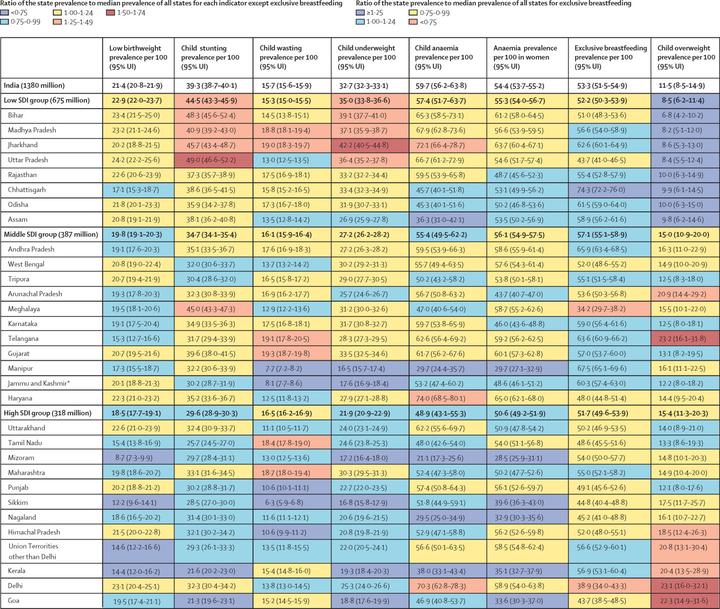
Malnutrition was the predominant risk factor for death in children younger than 5 years of age in every state of India in 2017, accounting for 68·2% (95% UI 65·8–70·7) of the total under-5 deaths, and the leading risk factor for health loss for all ages, responsible for 17·3% (16·3–18·2) of the total disability-adjusted life years (DALYs). The malnutrition DALY rate was much higher in the low SDI than in the middle SDI and high SDI state groups. This rate varied 6·8 times between the states in 2017, and was highest in the states of Uttar Pradesh, Bihar, Assam, and Rajasthan. The prevalence of low birthweight in India in 2017 was 21·4% (20·8–21·9), child stunting 39·3% (38·7–40·1), child wasting 15·7% (15·6–15·9), child underweight 32·7% (32·3–33·1), anaemia in children 59·7% (56·2–63·8), anaemia in women 15–49 years of age 54·4% (53·7–55·2), exclusive breastfeeding 53·3% (51·5–54·9), and child overweight 11·5% (8·5–14·9). If the trends estimated up to 2017 for the indicators in the NNM 2022 continue in India, there would be 8·9% excess prevalence for low birthweight, 9·6% for stunting, 4·8% for underweight, 11·7% for anaemia in children, and 13·8% for anaemia in women relative to the 2022 targets. For the additional indicators in the WHO and UNICEF 2030 targets, the trends up to 2017 would lead to 10·4% excess prevalence for wasting, 14·5% excess prevalence for overweight, and 10·7% less exclusive breastfeeding in 2030. The prevalence of malnutrition indicators, their rates of improvement, and the gaps between projected prevalence and targets vary substantially between the states.
Malnutrition continues to be the leading risk factor for disease burden in India. It is encouraging that India has set ambitious targets to reduce malnutrition through NNM. The trends up to 2017 indicate that substantially higher rates of improvement will be needed for all malnutrition indicators in most states to achieve the Indian 2022 and the global 2030 targets. The state-specific findings in this report indicate the effort needed in each state, which will be useful in tracking and motivating further progress. Similar subnational analyses might be useful for other low-income and middle-income countries.